Mapping soil contamination
Soil contamination is probably one of the things we can all agree about, that we do not want to find – at least not on our own property. And overall, there is probably an agreement of getting rid of it as fast as possible, which is quit a enormous task.
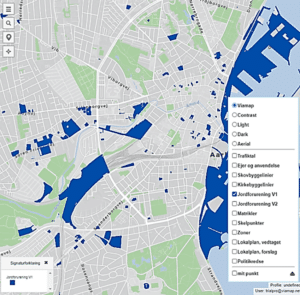
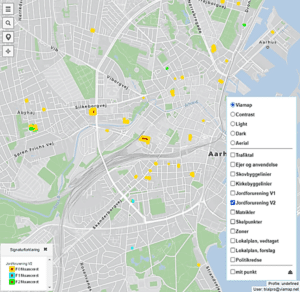
One thing is to map the soil pollution, but there is also a clean-up task, which is an expensive affair. Mapping of soil contamination on properties is carried out by the Regions in Denmark and registered in DKJord. Soil contamination is recorded at 2 levels (V1 and V2):
V1: When there is actual historical knowledge that there has been an industry or other activity on the property that causes it to be contaminated
V2: A property is mapped at knowledge level 2 when there is information about or it has been established that there is a contamination on the property that may cause an environmental or health risk.
In our Mapit solution we have added V1 as well as a nuanced version of V2, which contains the 3 categories F0, F1 and F2:
F0: No health risk when using house and garden
F1: No health risk when using house and garden if you follow simple advice
F2: Health risk when using house and garden. Must be investigated further.


It is the public authority, the Regions, that has the responsibility of mapping contaminated propeties. In the Capital Region, there are 35,000 properties, of which 6,500 have currently been mapped as being polluted or under suspicion of polluted.
Old contaminants
These are typically “old pollutants” that have occurred years ago from various industries: lead from petrol or zinc or consumer products such as paint, paper and batteries etc.
Unfortunately, pollution does not just lie still in the ground – it spreads, for example, with rainwater and seeps into the groundwater.
The data layers are a licensed part of Mapit. If you are interested in know more about Mapit in general or having the data layers added to your extisting Mapit license, please contact us

